
 North America
 UK
UK Europe
 Australia
 New Zealand
Market Size, Supply Dynamics & Investment Implications • February 2026
Why This Industry Matters Right Now
The U.S. Vehicle, RV & Boat Storage market has moved far beyond a niche parking solution. Millions of Americans now own RVs, boats, trailers, collector cars, and work vehicles that do not fit into standard garages or residential driveways. At the same time, zoning rules, homeowner associations (HOAs), and neighborhood density increasingly prevent people from storing these assets at home. The result is one of the most pronounced and persistent supply gaps in the broader storage industry.
Supply gap snapshot
Ownership is already massive and still growing. Roughly 8 million U.S. households own an RV alone, with another 16.9 million households expressing interest in purchasing one over the next five years. When boats, trailers, and specialty vehicles are included, nearly 25 million U.S. households now own a large recreational or specialty vehicle that requires off-site storage. Yet according to StorTrack data, there are fewer than 5,000 purpose-built facilities designed specifically to store them.
Regulatory pressure amplifies demand
HOAs and municipalities increasingly restrict parking of RVs, boats, and trailers in driveways or streets. As housing density rises and lot sizes shrink, off-site storage shifts from convenience to necessity for millions of owners.
Even with new development underway, supply is not keeping pace with demand. StorTrack is tracking more than 200 RV & Boat Storage projects under development, but industry estimates indicate the market would need more than double today’s purpose-built inventory simply to keep pace with current ownership and usage trends.
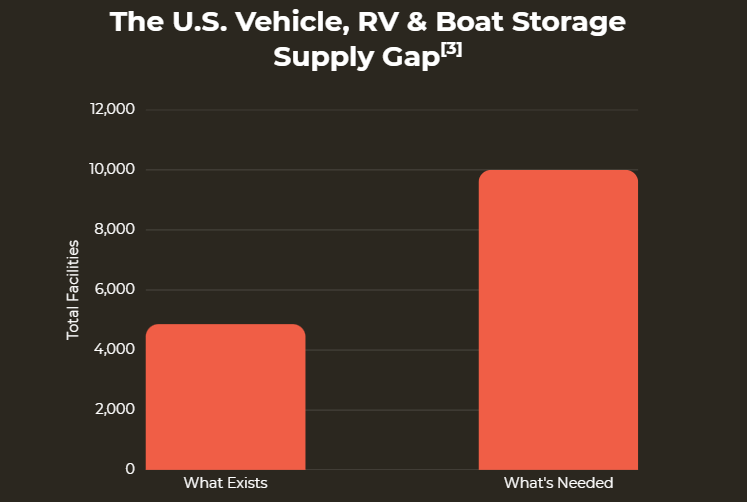
Existing Vehicle, RV & Boat Storage capacity represents less than half of what is needed to support current ownership levels [3].
[2] Toy Storage Nation (TSN), “RV & Boat Storage Reaches Crisis Levels, Signaling Entrepreneurs to Pounce on Booming Opportunity,” September 15, 2025.
[3] Based on industry estimates that the U.S. requires approximately 5 times the historical inventory of roughly 2,000 dedicated RV and boat storage facilities to serve an ownership based of ~25 million households, implying a market-clearing level of approximately 10,000 purpose-built facilities.
How Big Is the Market?
Despite the scale of ownership, true storage capacity remains limited.
Based on StorTrack data (as of January 2026):
Even at today’s scale, supply remains well below what is needed to serve existing demand. That gap is further widened by the fact that most facilities classified as “hybrid” devote only limited space to vehicle parking, leaving the true RV and boat storage capacity far more constrained than headline facility counts imply.
Types of Vehicles, RV & Boat Storage
Vehicle, RV & boat storage refers to facilities designed to store:
- Recreational vehicles (RVs) and campers such as Class A, B, and C motorhomes, travel trailers, fifth wheels, pop-up campers, and camper vans
- Boats and watercraft
- Trailers and haulers including utility trailers, boat trailers, and toy haulers
- Work trucks and commercial vehicles
- Other recreational equipment such as ATVs
Facilities are designed with wide drive aisles, tall clearances, gated access, and enhanced security, making them fundamentally different than traditional self-storage.
Storage Formats
Roofed parking that provides protection from the elements while maintaining open sides. Covered spaces are popular for motorhomes and high-value vehicles that need weather protection without full enclosure.
Fully enclosed units, sometimes climate-controlled, offering maximum security and protection from weather. These are preferred for assets such as luxury motorhomes, high-end boats, and collector and performance vehicles.
Common Sizes and Uses
| Unit Size | Square Feet | Some Common Uses |
|---|---|---|
| Small | 150-240 sqft. | Motorcycles, jet skis, small trailers |
| Medium | 241-420 sqft. | Small boats on trailers, compact RVs, extra cars |
| Large | 421-540 sqft. | Tractor-trailers, fishing boats, utility trailers |
| XL | 541+ sqft. | Motorhomes, fifth wheels, large boats |
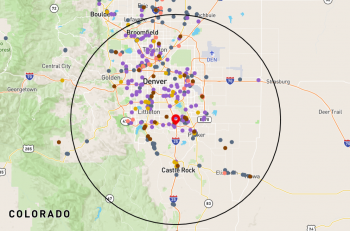
Where Supply Is Concentrated
Dedicated vehicle, RV, and boat storage is concentrated in fast-growing, recreation-oriented states that combine strong population inflows with high vehicle ownership.
Vehicle, RV & Boat Storage Facilities by State
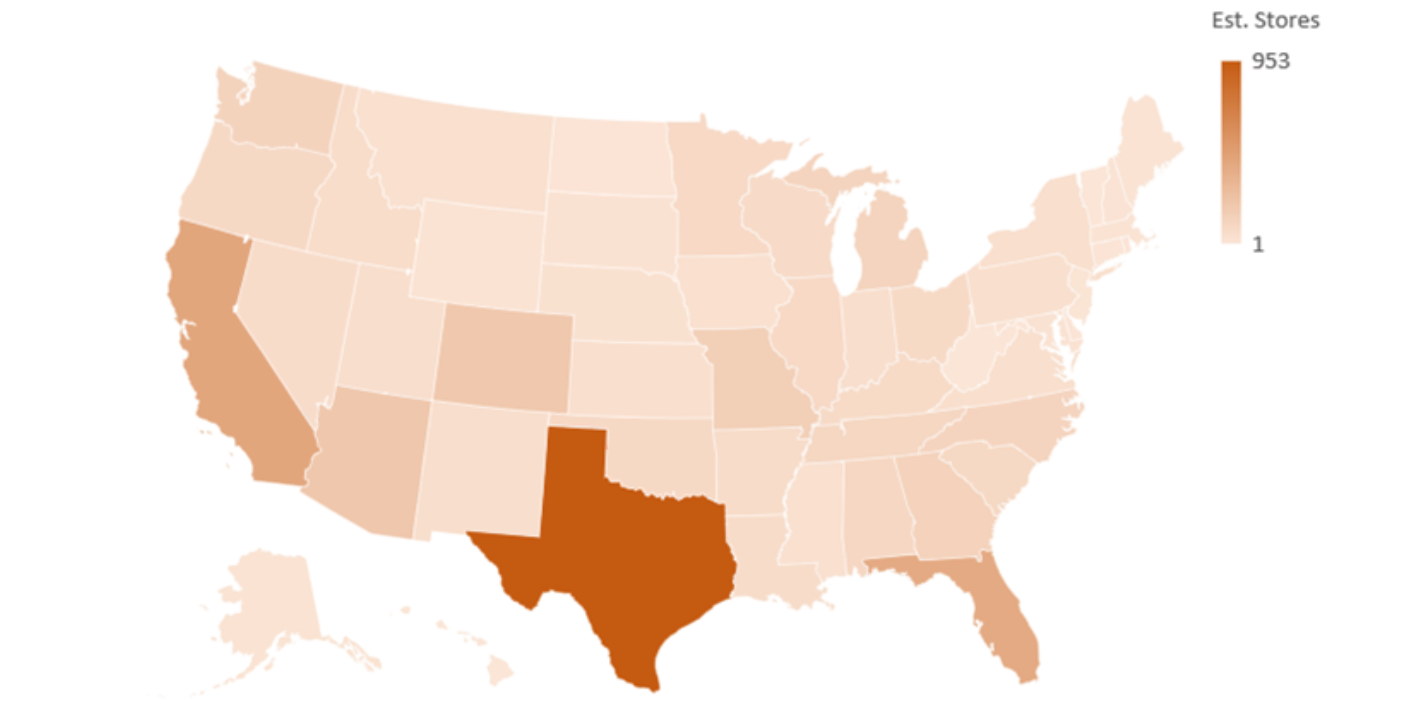
Top States: Dedicated Facilities
The top 5 markets purpose-built facilities
are:
| Texas | 953 |
| California | 433 |
| Florida | 404 |
| Arizona | 206 |
| Colorado | 197 |
Top States: Hybrid Facilities
Hybrid facilities follow a similar Sun Belt-heavy pattern:
| Texas | 3,832 |
| California | 2,179 |
| Florida | 1,969 |
| North Carolina | 1,190 |
| Georgia | 1,037 |
Investment Trend & Industry Growth
Vehicle, RV & Boat Storage brings together rising vehicle ownership, tighter residential parking rules, and limited purpose-built supply into a compelling growth story. The business model spans both low-cost outdoor parking and high-value enclosed storage, allowing operators to serve a broad customer base while capturing both margin efficiency and pricing power.
New development is focused on properties that offer covered and enclosed units, wide drive aisles, enhanced security, and premium amenities such as wash bays, dump stations, electrical hookups, and solar canopies. As the value of stored assets continue to rise, often exceeding six figures, owners are willing to pay more for protection and convenience, positioning Class A RV and boat storage as a distinct, higher-performing asset class within the broader storage landscape.
Demand remains robustAccording to RVIA’s RV Roadside forecast, wholesale RV shipments are expected to total around 349,300 units in 2026, slightly above 2025 levels and near the highest totals seen in recent years, reflecting stable production and consumer interest in RV travel. Meanwhile, the National Marine Manufacturers Associate (NMMA) reported that in 2024, the U.S. recorded 238,117 new boat sales, demonstrating the ongoing strength of recreational boating and underlying participation trends. These continued patterns of RV and boat ownership reinforce long-term demand for secure off-site space, as these assets are used only part of the year and require dedicated space when not in use.
How Do Vehicle, RV & Boat Storage
Rates Compare by Facility and Unit Type?
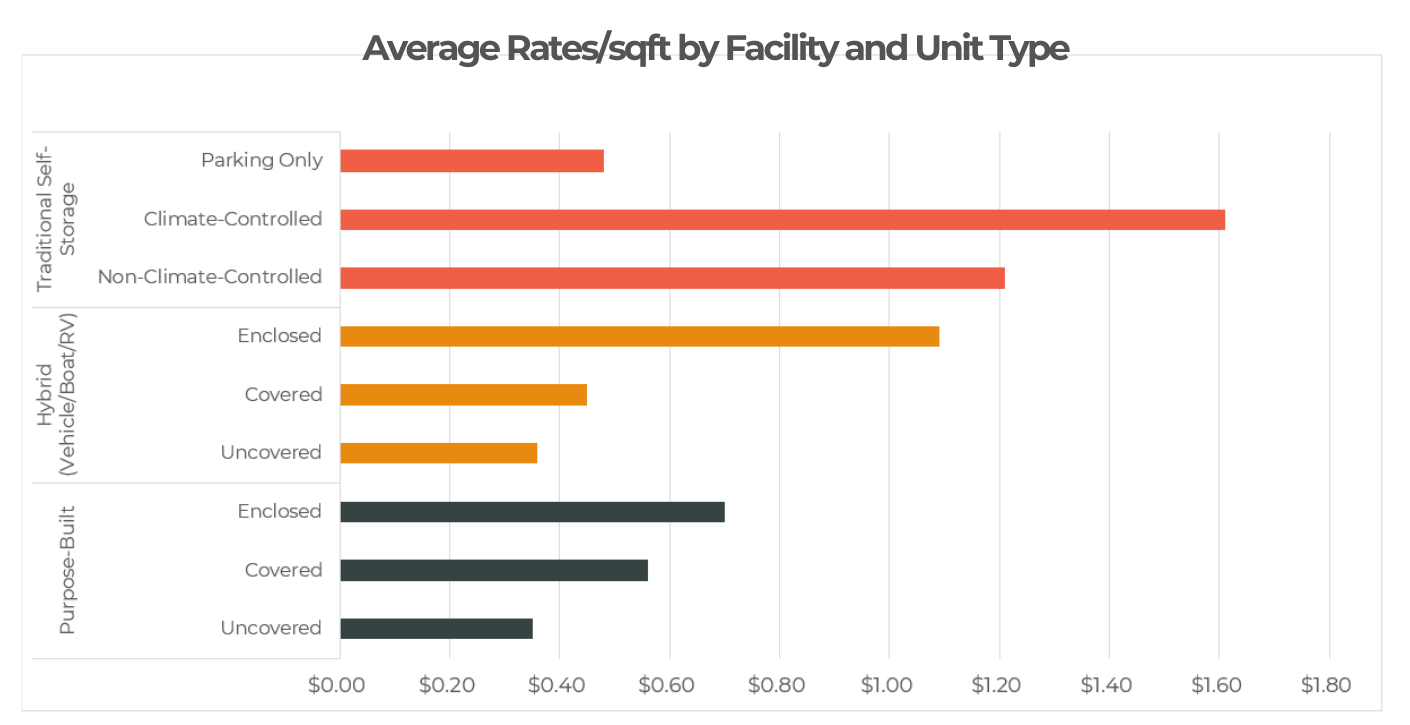
StorTrack data indicates a clear pricing hierarchy based on facility design and the level of asset protection provided. Traditional self-storage commands the highest average rates, with climate-controlled units at $1.61/sqft and non-climate-controlled units at $1.21/sqft. Within the specialized sectors, hybrid facilities command significant premium pricing power, where enclosed units average $1.09/sqft., or a 55% difference over standard purpose-built enclosed storage ($0.70/sqft). This rate gap suggests that while purpose-built facilities provide dedicated environments, hybrid models successfully leverage their diverse service offerings to capture higher rents for enclosed spaces. Conversely, baseline uncovered parking remains consistent across the industry, with rates averaging approximately $0.35/sqft. regardless of the facility’s primary classification.
Want to check rates for a specific market? Get Instant Access with Explorer
At a Glance
Explore Vehicle, RV & Boat Storage Market Dynamics
Sign up for Explorer to analyze pricing, supply, demand, and competitive positioning across Vehicle, RV & Boat storage markets. Get the market intelligence you need to evaluate opportunities, benchmark performance, and make informed investment decisions.
About StorTrack
StorTrack is the leading authority in self-storage market data and analytics, trusted by operators, investors, developers, and analysts across the globe. Since 2014, StorTrack has delivered the industry’s most comprehensive and accurate insights on pricing, supply, demand, and market trends. Our powerful platforms— Explorer and Optimize—enable data-driven decisions for everything from site selection and feasibility to revenue optimization and competitive benchmarking. With coverage spanning the U.S., Canada, UK, Europe, Australia, and New Zealand, StorTrack empowers professionals to move with confidence in an increasingly complex and competitive landscape.